Samuel Wan
The Director of Global Macro at Fidelity, Jurrien Timmer, tweeted his analysis of the current situation following Bitcoin’s sell-off in recent weeks.
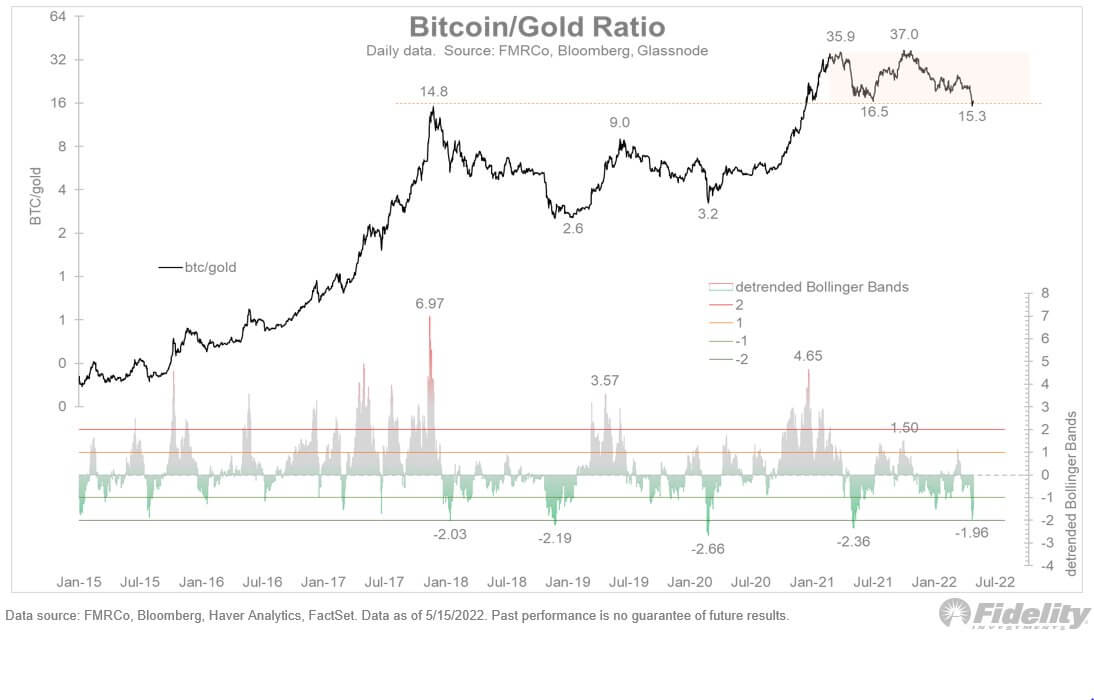
Using a variety of metrics, in particular the Bitcoin-gold ratio, Timmer concluded that Bitcoin is ‘at solid support’ and is ‘attractively’ priced.
“All of the above tells me that Bitcoin is not only at solid support but also attractively valued.“
However, the optimism was tempered by a warning on stock correlation, which he says, must confirm a recovery or else his analysis becomes invalidated.
Lately, investors have flipped risk-off, choosing to flee to dollar ‘safety.’ The knock-on effects have seen capital flight from risk-on assets, which continue to show hesitancy.
And, with a global slowdown on the horizon, some say dollar flight will only accelerate in the coming weeks and months. As such, expecting Bitcoin to hold current levels may be overly optimistic.
The Bitcoin gold ratio is trending downwards
In drawing his conclusion of Bitcoin holding current price levels, Timmer referred to several metrics. Those were:
- the rising dormancy flow, which Timmer likens to a measure of BTC moving from weak to strong hands.
- the BTC demand model showing Bitcoin dipping below internet and phone adoption rates.
- price falling below the S2F model projection, which looks at the supply (or stock) against the annual production (or mining output).
- the number of hodlers (holding for more than 10 yrs) remaining steady, at 13%.
But perhaps most significantly, Timmer also refers to the Bitcoin gold ratio, pointing out that the ratio is now at major support. According to the chart below, currently, one BTC equals 15.3 ozs of gold. This has fallen by more than half compared to November 2021, at BTC’s all-time high.
Nonetheless, in further support of his argument, Timmer points out that the ‘detrended Bollinger Band’ is almost two standard deviations below 0, implying the ratio could rise.
“At the same time, the detrended Bollinger Band shows that the ratio is now at 2 standard deviations below trend, which is a level that has contained the last 3 declines.“

The case against
Speaking to Stansberry Research, Gareth Holoway, the CFO of InTheMoneyStocks.com, used technical analysis to build a case for further declines in the Bitcoin price.
Holoway states as nothing in the chart has changed, BTC needs to retest the 2017 high of $20,000.
“Right now, nothing in the chart has changed so twenty thousand is the high end of my target. Just to understand where that’s coming from, it’s coming from the 2017 high. I believe we have to get back there.”
Referring to the macro landscape, he mentions that this is the first time in Bitcoin’s history that it is facing quantitative tightening. Thus, he concludes that a more significant correction is set to happen.
Holoway states the lower end of his prediction would see Bitcoin at $12,000. Holoway derived the predicted valuation by looking at the measured move down from November 2021’s high and applying the scale of decline against the previous local top of $48,000.
