
Sahil Mahadik
XRP Price Prediction: A healthy retracement in XRP price should bolster buyers for higher recovery; Enter now?
Published 7 hours ago
XRP Price Prediction: In the context of current market volatility, the fifth-largest cryptocurrency XRP, has undergone a notable reversal from its recent peak of $0.73. Over the past two weeks, the value of the XRP coin has decreased by 20%, resulting in a current price of approximately $0.6, and its market capitalization has fallen to $32.4 billion. However, an analysis of the 4-hour time frame chart suggests that this correction may be forming a bullish continuation pattern known as a ‘flag’.
Also Read: Ripple And Whales Move 200 Mln XRP Amid Price Slump
XRP Price Prediction: Will $XRP Lose $0.6 Mark?
- Flag pattern formation for buyers an opportunity to replenish bullish momentum before the next leap
- The confluence of several chart levels at $0.6 creates a strong support zone
- The intraday trading volume in the XRP is $1.39 Million, indicating a 30% gain.
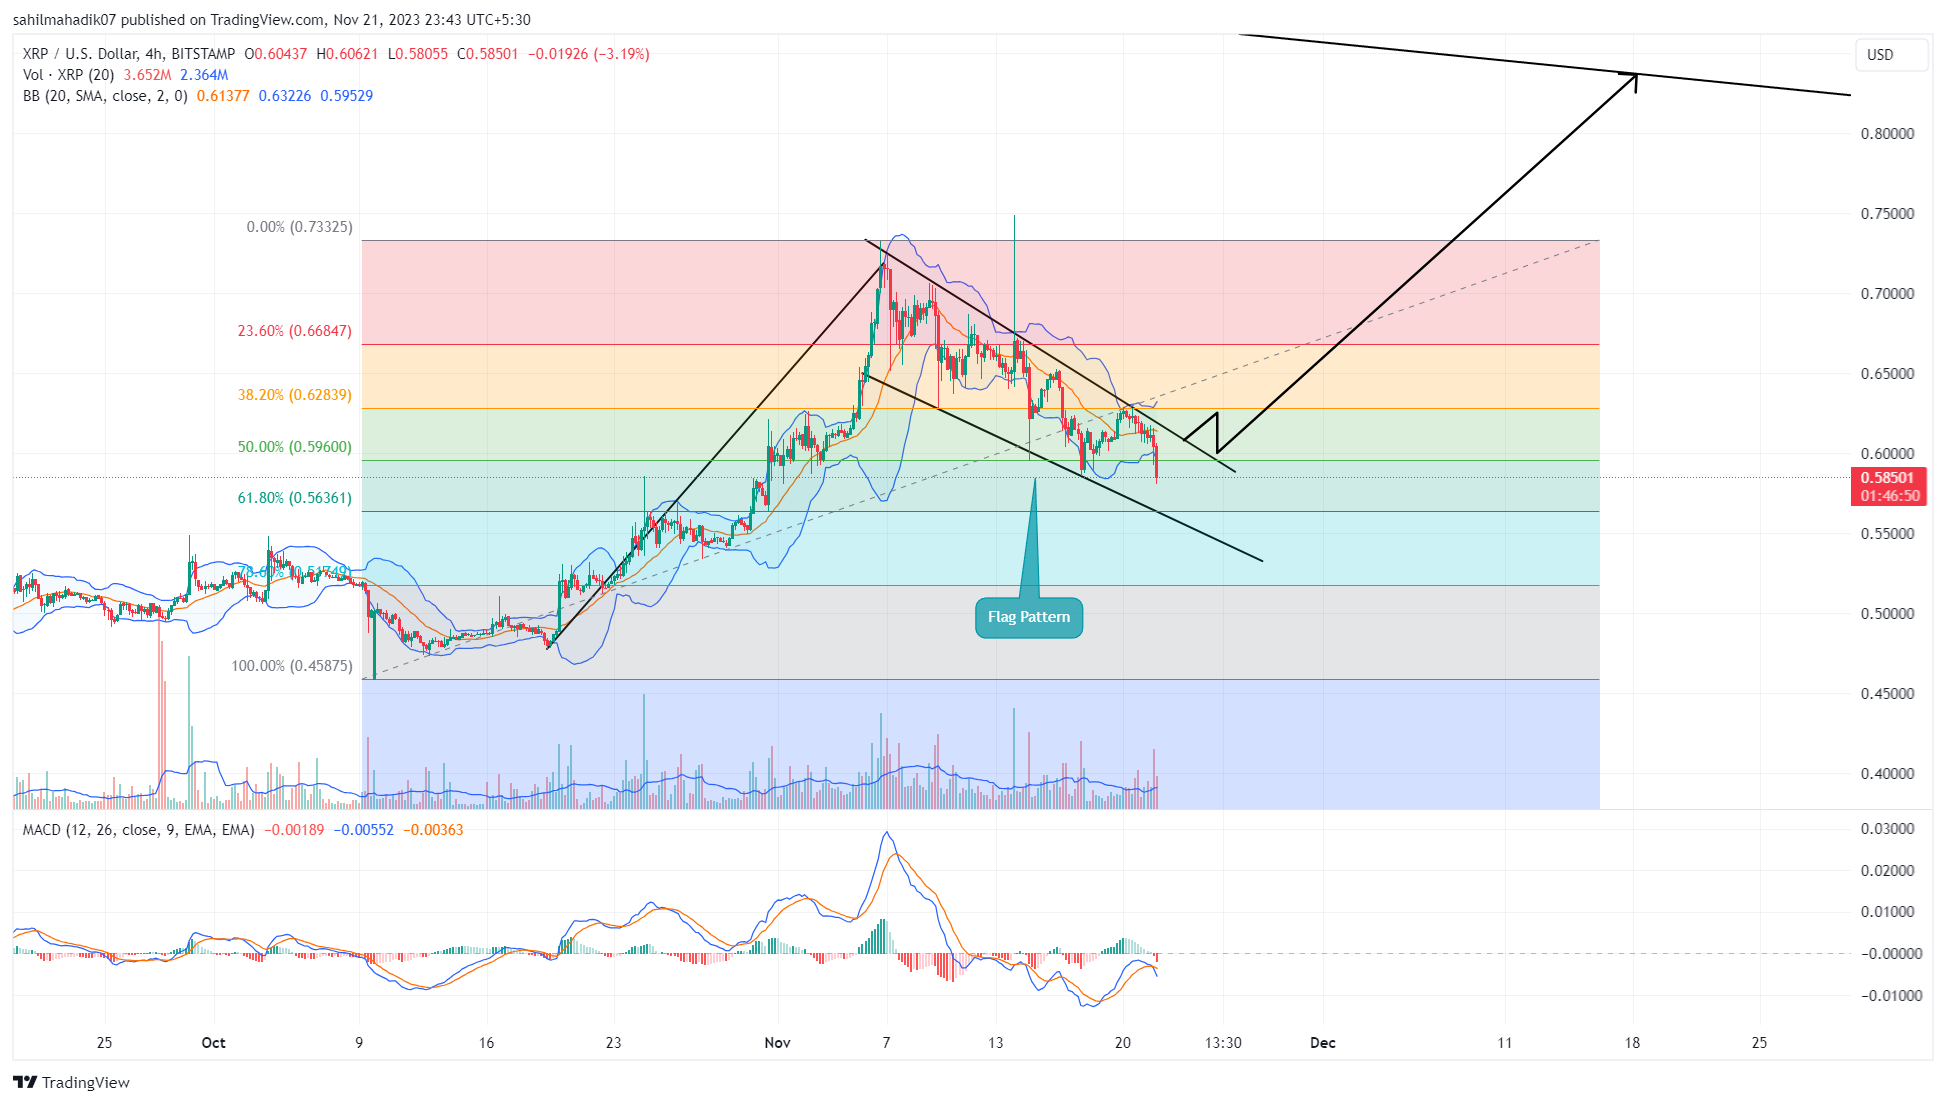 Source: Tradingview
From mid-October and early November, XRP coin experienced significant growth, with its price increasing from $0.477 to a high of $0.732, marking a gain of 53.5%. Despite this positive trend, the recovery faced a reversal amid growing indecisiveness among investors.
Having said that, this correction in tandem with low volume is finding suitable support at the combined support of $0.6 and 50% Fibonacci retracement level. Such retracements are often viewed as beneficial for regenerating momentum and resuming an upward trend. Furthermore, the XRP price is currently confined within two downward-sloping trendlines, indicating the formation of a bullish flag pattern.
This pattern suggests that the coin price might breach the upper trendline, potentially propelling a recovery of up to 40%, targeting around $0.83.
However, this target level aligns with a long-standing trendline, which could act as a significant resistance and possibly hinder the recovery.
Multi-Year Pattern Hints Sideways Trend Ahead
 Source: Tradingview
A look at the monthly time frame chart shows the XRP price has been resonating within the two converging trendlines of a symmetrical triangle pattern since 2018. The coin price reverted from both the upper and lower trendlines At least twice indicating the strong influence this pattern has on XRP. As the current recovery in this asset is poised to reach the upper trendline, the XRP price may face a huge surge in supply pressure which could trigger a fresh correction trend. Thus, Until this chart pattern is intact, the XRP price may prolong its sideways stretch.
- Bollinger Band: The Bollinger Band challenge on the downside reflects the selling momentum is active.
- Moving Average Convergence Divergence: A bearish crossover within the MACD and signal line highlights the ongoing correction trend.
Share this article on:
The presented content may include the personal opinion of the author and is subject to market condition. Do your market research before investing in cryptocurrencies. The author or the publication does not hold any responsibility for your personal financial loss.